Setup
Overview
A metric is a measurement of success for your experiment on your website, application, backend performance, etc. It tells you if your experiments are improving, degrading, or are having no effect on your visitors’ experience, based on their behavior.
You can measure customer behavior and customer experience in your application by sending events such as clicks, views, checkout events, page load time, or any other event that measures behavior or experience. This helps you make informed decisions about your product and performance.
Once you begin collecting and analyzing your data, you’re likely to find it easier to reach a confident decision about your business challenges, allowing for continuous improvements over time. Also, having all of your key data points attached directly to your feature flags can help you roll out new products and manage risks.
Metrics can be created in Split when you have two types of data: impressions and events.
- Impressions occur when a visitor is assigned a treatment (i.e., variations) for a feature flag.
- Events track information and actions a user takes while in that feature flag.
You can create a metric, monitor, and measure impact in six steps:
- Define your metric name and information
- Define your metric definition
- Create an alert policy
- Manage alerts
- Review metrics impact during a review period
- Analyze metric impact details and trends over time
Define your metric name and information
Once you are sending us event data, to create your first metric, click on the metrics icon in the left navigation and click the Create metric button. Enter your metric name. We recommend describing what you intend to measure with a unique and recognizable name. Similar to feature flags, you can easily specify meta information for your new metric such as name, description, owners, and tags. This information can help you and your team manage your metrics. Learn more about creating a metric.
Define your metric definition
When defining the metric definition, determine the winning direction. If increasing this metric is good for your business and customer experience, select increase. If not, select decrease. The traffic type applies to the event type associated with the metric. Select traffic type user. To get started, select count of events per user and select an event you sent.
You can define what you want to measure. To define your metric:
- In the Select the desired impact field, select whether you would like to see this metric increase or decrease. In most A/B testing tools, this would be deemed the winning direction.
- In the Select traffic type field, select what traffic type you would like to measure this metric for. Be aware that the traffic type for the metric must match the traffic type for the feature flag you want it applied to.
- In the Measured as field, define functions to perform or calculate specific analyses on events. These functions can be performed per your traffic type.
- In the Value field, optionally select which property you want to use as the value field. For more information, see Event properties.
- In the Properties field, optionally define if there are any specific event properties to filter by for measuring this metric. For more information, see Event properties.
Statistical comparison (Measured per user)
When calculating metrics per user, first each user's individual contribution is calculated. Then each user adds a single data point to the distribution of the user metric results, hence they all have the same weight in the result. We use the resulting distribution for statistical testing of the metrics below.
All the examples assume that users are used for the traffic type in the experiment and the users were exposed to a particular treatment of a particular feature flag version. While this states for each user, it’s whatever traffic type you’re using at the time.
| Function | Description | Example |
|---|---|---|
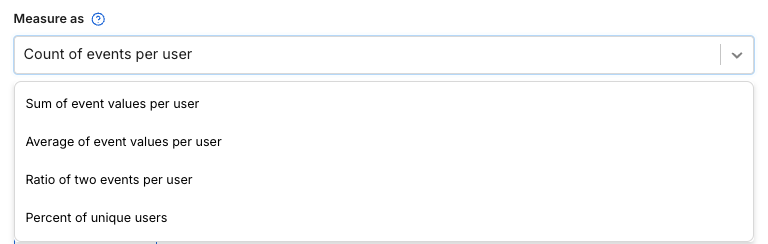
| Count of events per [traffic type] | For each traffic type, the number of times they perform an event is calculated. | Measure the average number of times a user visits your website. Measure the average number of support tickets a user files with your support team. |
| Sum of event values per [traffic type] | For each traffic type, the sum of their event values is calculated. | Measure the total value of items purchased by a user. Measure the total number of minutes a user listened to media on your website. |
| Average of the event values per [traffic type] | For each traffic type, the average value of the user's events is calculated. | Measure the average value of items a user purchases. Measure the average page load time a user experiences. |
| Ratio of two events per [traffic type] | For each traffic type, the ratio of the number of times two different events are performed is calculated. | Measure the number of hotel searches that occur for a user to make a hotel booking. Measure the number of invites sent for a user to accept the invite. |
| Percent of unique [traffic type] | The number of distinct traffic types that performed the event as a percent of those in the sample is calculated. | Measure what percent of your sample size clicked the checkout button. Measure the percent of users who filed a support ticket. |
Create an alert policy
An alert policy allows you to configure a degradation threshold for your metric. If the feature flag causes the metric to go below or above that threshold you are alerted by your configured notification channel. Learn more about creating an alert policy.
Manage alerts
Any alerts which are triggered are displayed both on the Targeting and Alerts tab on the feature flag page. When you receive an alert, you can quickly rollback the feature flag by clicking kill or dismiss the alert. Learn more about managing alerts.
Review metrics impact during a review period
The review periods are preset using the admin settings. You can access your metrics impact by searching for the feature flag you want to see the impact for and navigating to the metrics impact tab. Once here, you see the impact on your metrics, first ordered by feature flag key metrics, then account-wide guardrail metrics, and then feature flag supporting metrics. Learn more about review periods and filtering your metrics.
Analyze metric impact details and trends over time
Information such as the impact %, p-value, and error margin are surfaced on the metric card. You can click on the metric card to access additional information. This additional information includes how the impact changed over time, the metric dispersion, and the sample size used to calculate the metric value. Learn more about metric details and trends.
Create a metric
To create a metric, do the following:
-
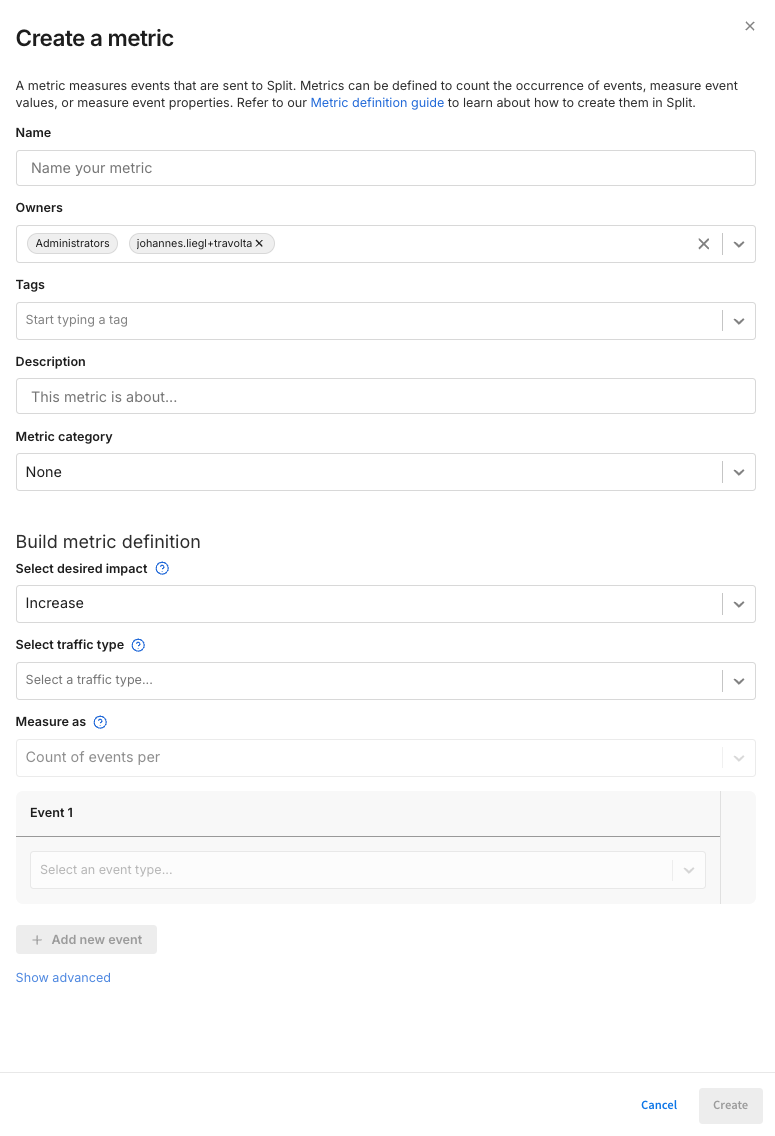
From the left navigation panel, click Metrics. Then, click the Create metric button. The Create a metric panel appears:
-
Provide the following details about the metric:
- Name: Enter a descriptive metric name up to 50 characters and without spaces.
- Owners: Select any number of Harness FME users to be the metric owners (e.g. administrators, homepage team). Owners can click Metrics in the left navigation panel and then view the metric in the Metrics menu’s browse pane when clicking Owned by me.
- Tags: Optionally add one or more tags to help you categorize the metric for a particular team or feature release.
- Description: Optionally describe what the metric measures and its purpose.
- Metric category: Choose to set the metric as one of your account's Guardrail metrics or leave the category as None. Guardrail metrics adhere to account-wide alerting settings. See the Metric categories section (below) for more information.
-
Define how the metric should be calculated:
-
Select desired impact: Select increase if an increase in this metric measurement is good for your business or customer experience. If not, select decrease.
-
Select traffic type: Choose the traffic type of the event you would like to measure. This is the traffic type specified when sending the event to Harness FME. It is also the traffic type defined for the feature flags that will show the results of the metric on the Metrics impact tab. To learn more, see the traffic type guide.
-
Measure as: Select the type of calculation to be performed on the event, event value, or event property. Learn more about metric types and their applications in the Metric types section.
-
Event: Select an event type to use in the metric calculation. To select more than one event to be used in the metric, click the Add event button.
- Click Add new filter to optionally apply a filter to the selected event using properties. For example, if you wanted to create a metric to count page views from California, you might select an event called
page.viewwith a property filter ofstatematchesCalifornia. RE2 syntax for regular expressions can be used in your filter.
- Click Add new filter to optionally apply a filter to the selected event using properties. For example, if you wanted to create a metric to count page views from California, you might select an event called
-
Value: For a sum or average metric, you can select the event value or a property value to be used for the calculation.
-
-
In the Advanced section of a metric definition, optionally apply the following settings:
- Filter by:
- No filter criteria: No filters are applied.
- Has done the following event prior to the metric event: This filter counts customers who have triggered an event at least once during the version of a feature flag, as long as it happened within the same feature flag version and before the metric event. For example, if you want to measure the count of add to cart events that happened after viewing the special offers page, select Added to cart for the metric event and Viewed special offers page for the filter by event.
- Has done the following event (not ordered): This filter counts customers who have triggered an event at least once during the version of a feature flag. As long as a customer triggered an event within the same feature flag version, the filter is applied even if it happened after the metric event. For example, if you want to measure the count of add to cart events that happened either before or after a user subscribed to the newsletter, select Added to cart for the metric event and Subscribed to newsletter for the filter by event.
- Properties: You can optionally apply a property filter to the Has done event you're filtering your metric by.
- Cap at: Apply a cap to your metric value to reduce the impact of outliers. Capping replaces any outlier values in your metrics by replaces them with a fixed threshold value. This reduces the variance and increases the sensitivity of your metric. Note: When a metric cap is set to a per user per day, this is 24 hours from a user’s first impression within a particular version of a feature flag.
- Filter by:
-
Click Create to create your metric.